FX-Strategy 19 Mar 2024
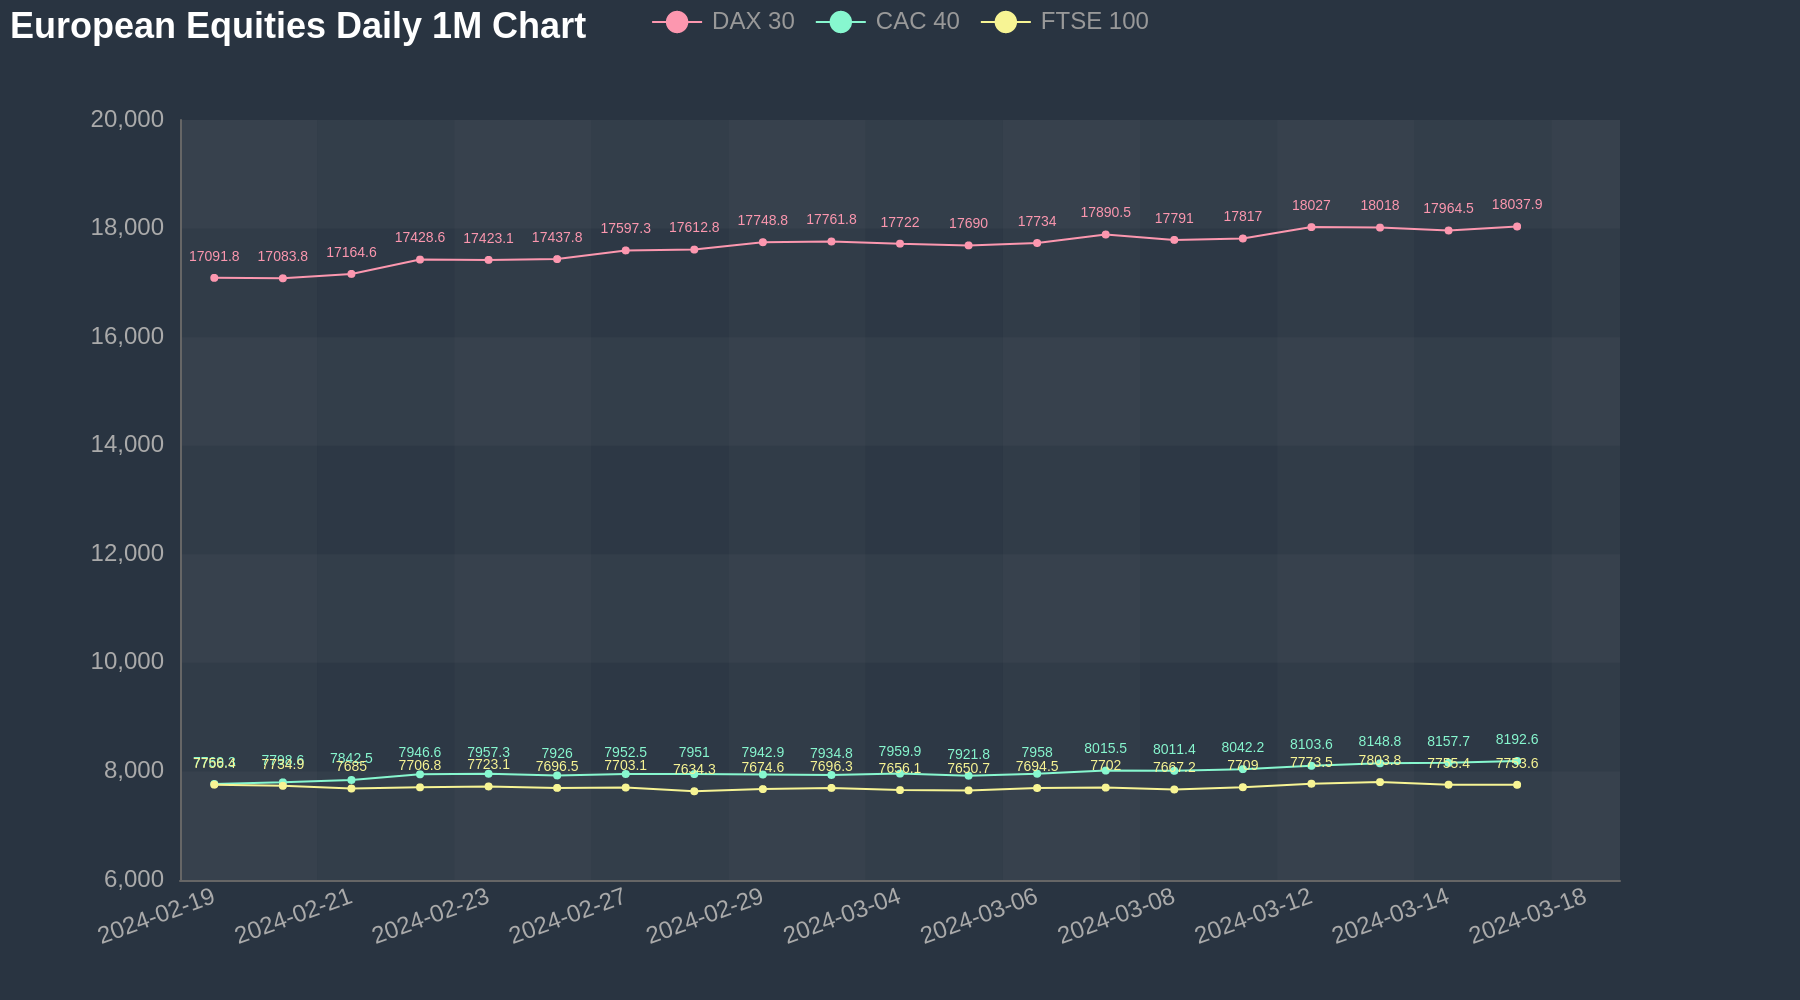
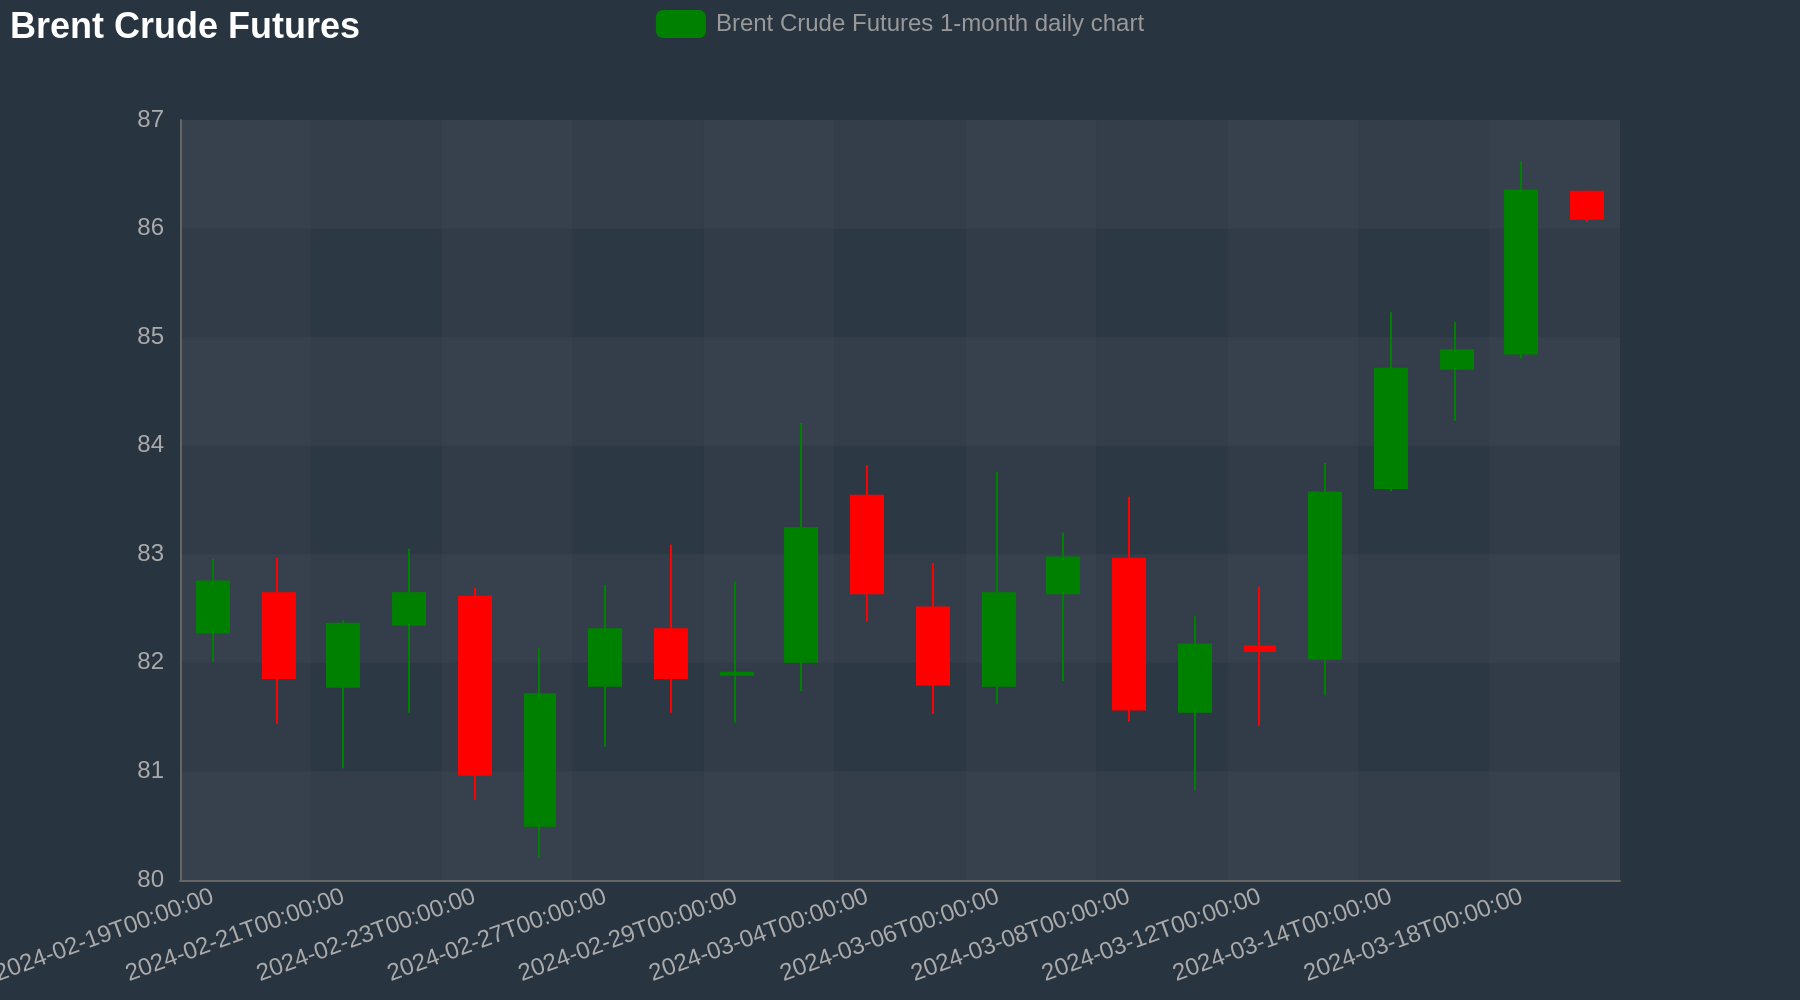
In the G10 FX Market, USD and EUR are the top gainers today while JPY and AUD are the top losers, down -0.87% and -0.67% versus the dollar, respectively. In the Asian equities, markets were trading mixed today. The Nikkei 225 was trading at 39897.0, up 0.73%. The Hang Seng was trading at 16530.0, down -0.72%. In the European equities, indices were trading mixed today. The DAX 30 was trading at nan, flat nan%. The CAC 40 was trading at nan, flat nan%. The FTSE 100 was trading at nan, flat nan%. Looking at Equity Futures so far,The SP500 Futures was trading at 5151.75, down -0.03%. In the Energy space, Oil futures were trading weaker today. The WTI Crude Futures was trading at 81.91, down -0.28%. The Brent Crude Futures was trading at 86.089, down -0.3%.
Download intraday historical Forex data in CSV files for free at TraderMade
European Equities Daily Chart (1-month)
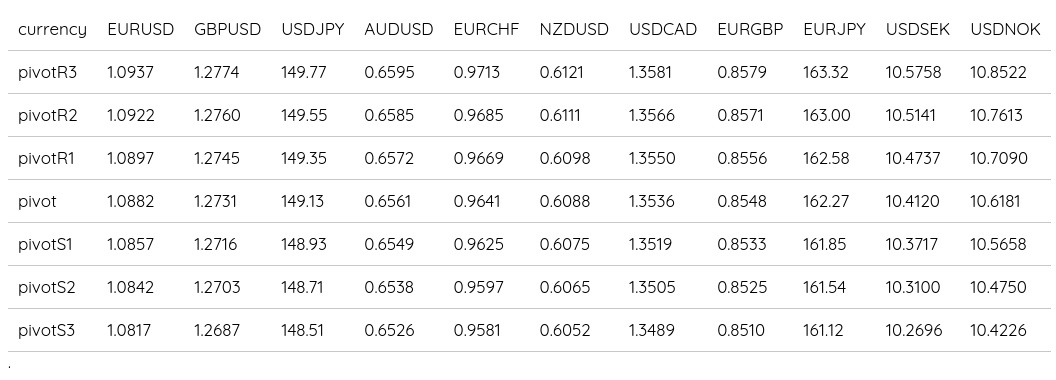
Daily FX Pivots
Brent Crude Daily Chart (1-month)
Forex Chart and Technical Analysis
EURUSD Chart (Two-week)
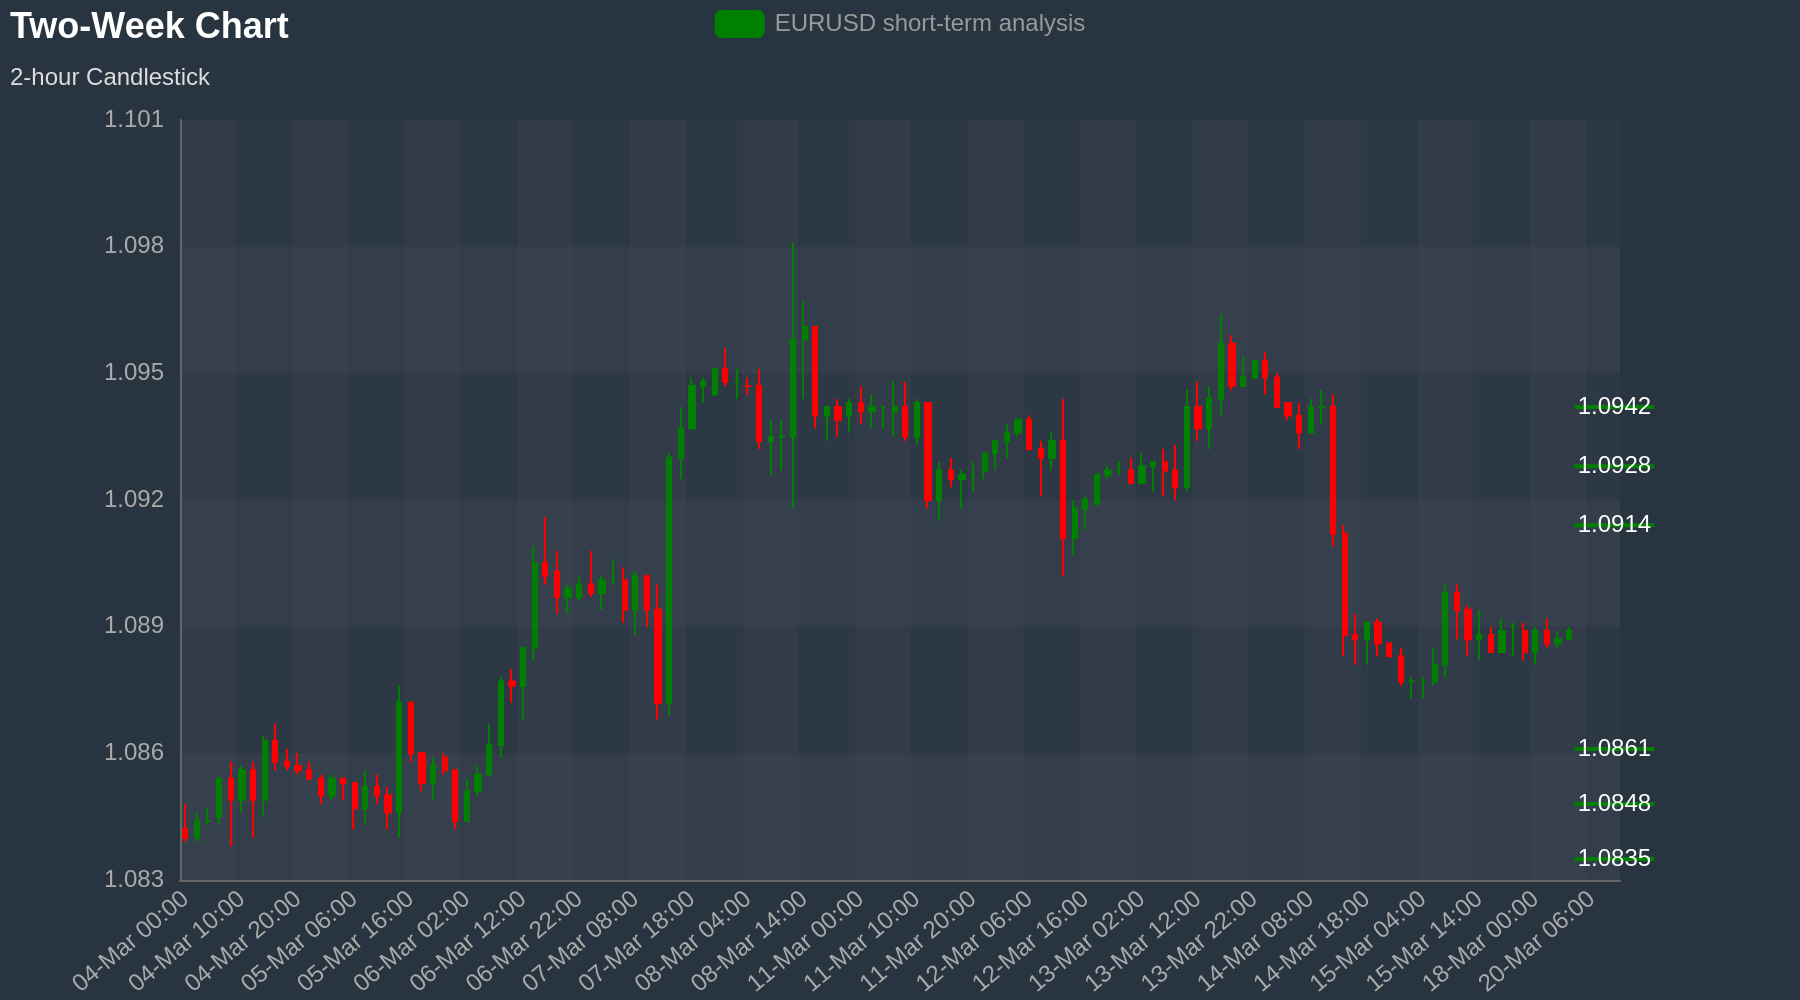
Strategy: Resistance at 1.0914 for 1.0861
Short-term view: EURUSD MACD and RSI are flat but resistance comes in at 1.0914 and we see a dip to 1.0861 enter at 1.0897. Above 1.0914 to open 1.0928
GBPUSD Chart (Two-week)
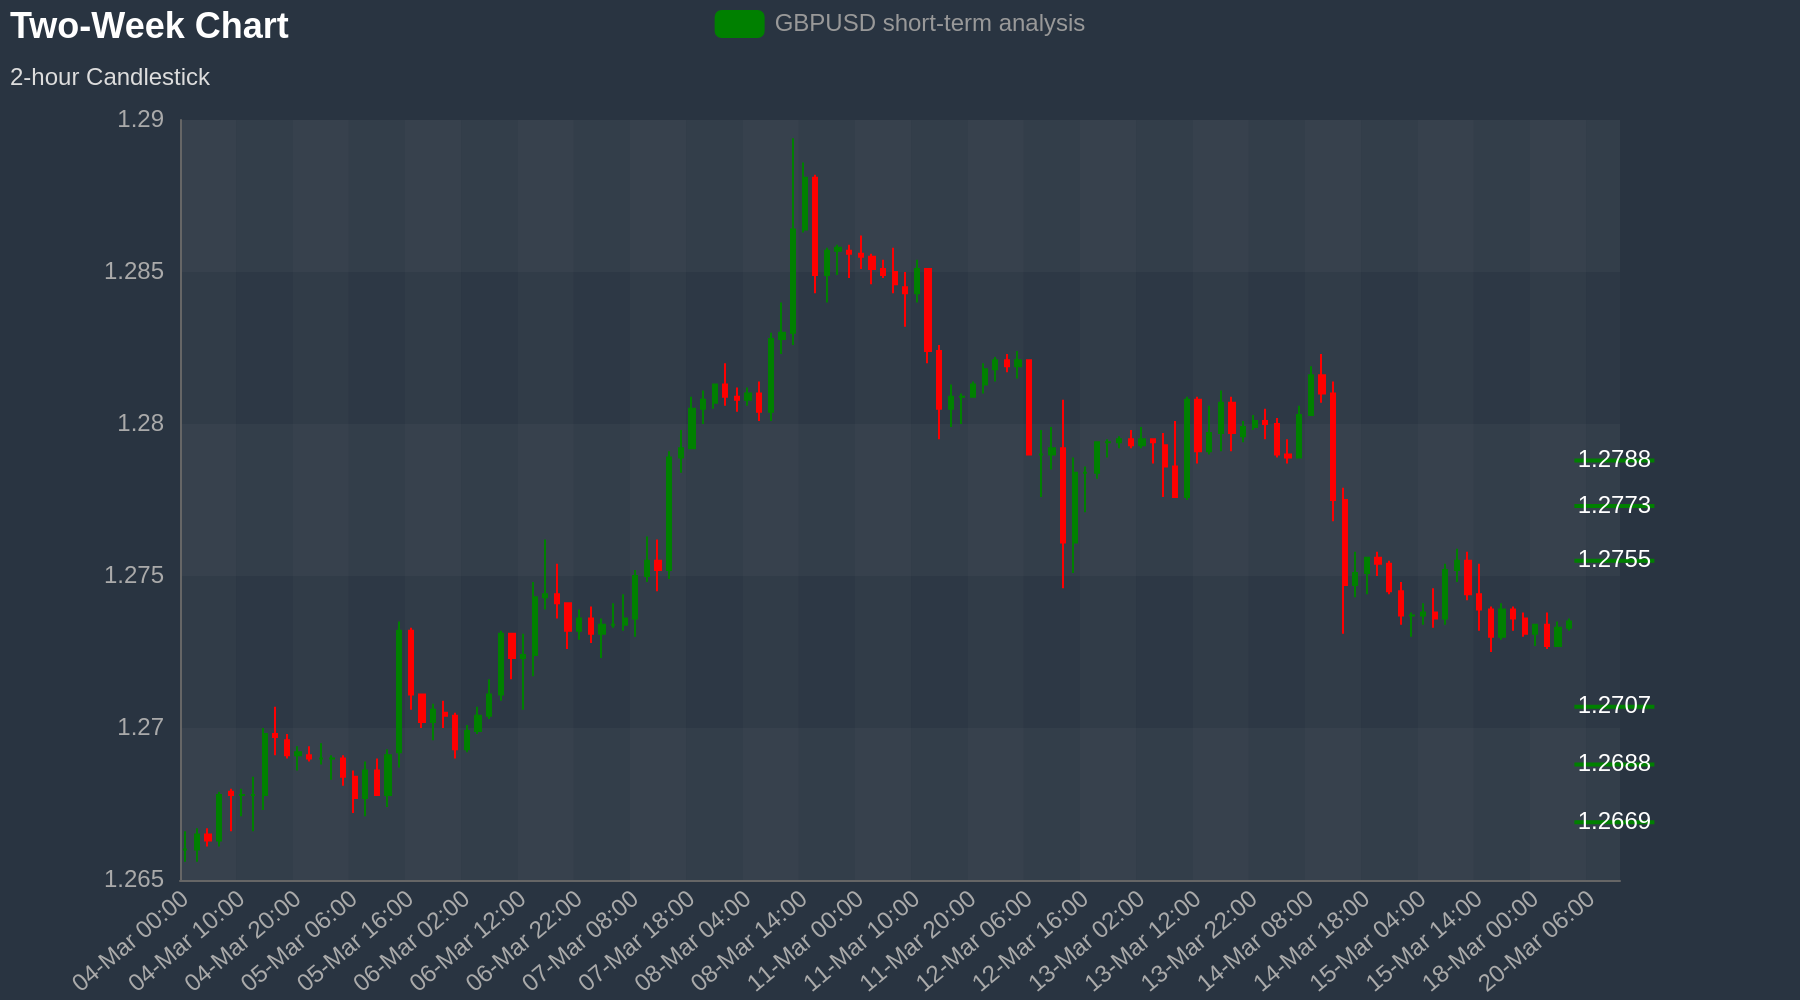
Strategy: Resistance at 1.2755 for 1.2707
Short-term view: GBPUSD MACD and RSI are flat but resistance comes in at 1.2755 and we see a dip to 1.2707 enter at 1.2739. Above 1.2755 to open 1.2773
USDJPY Chart (Two-week)
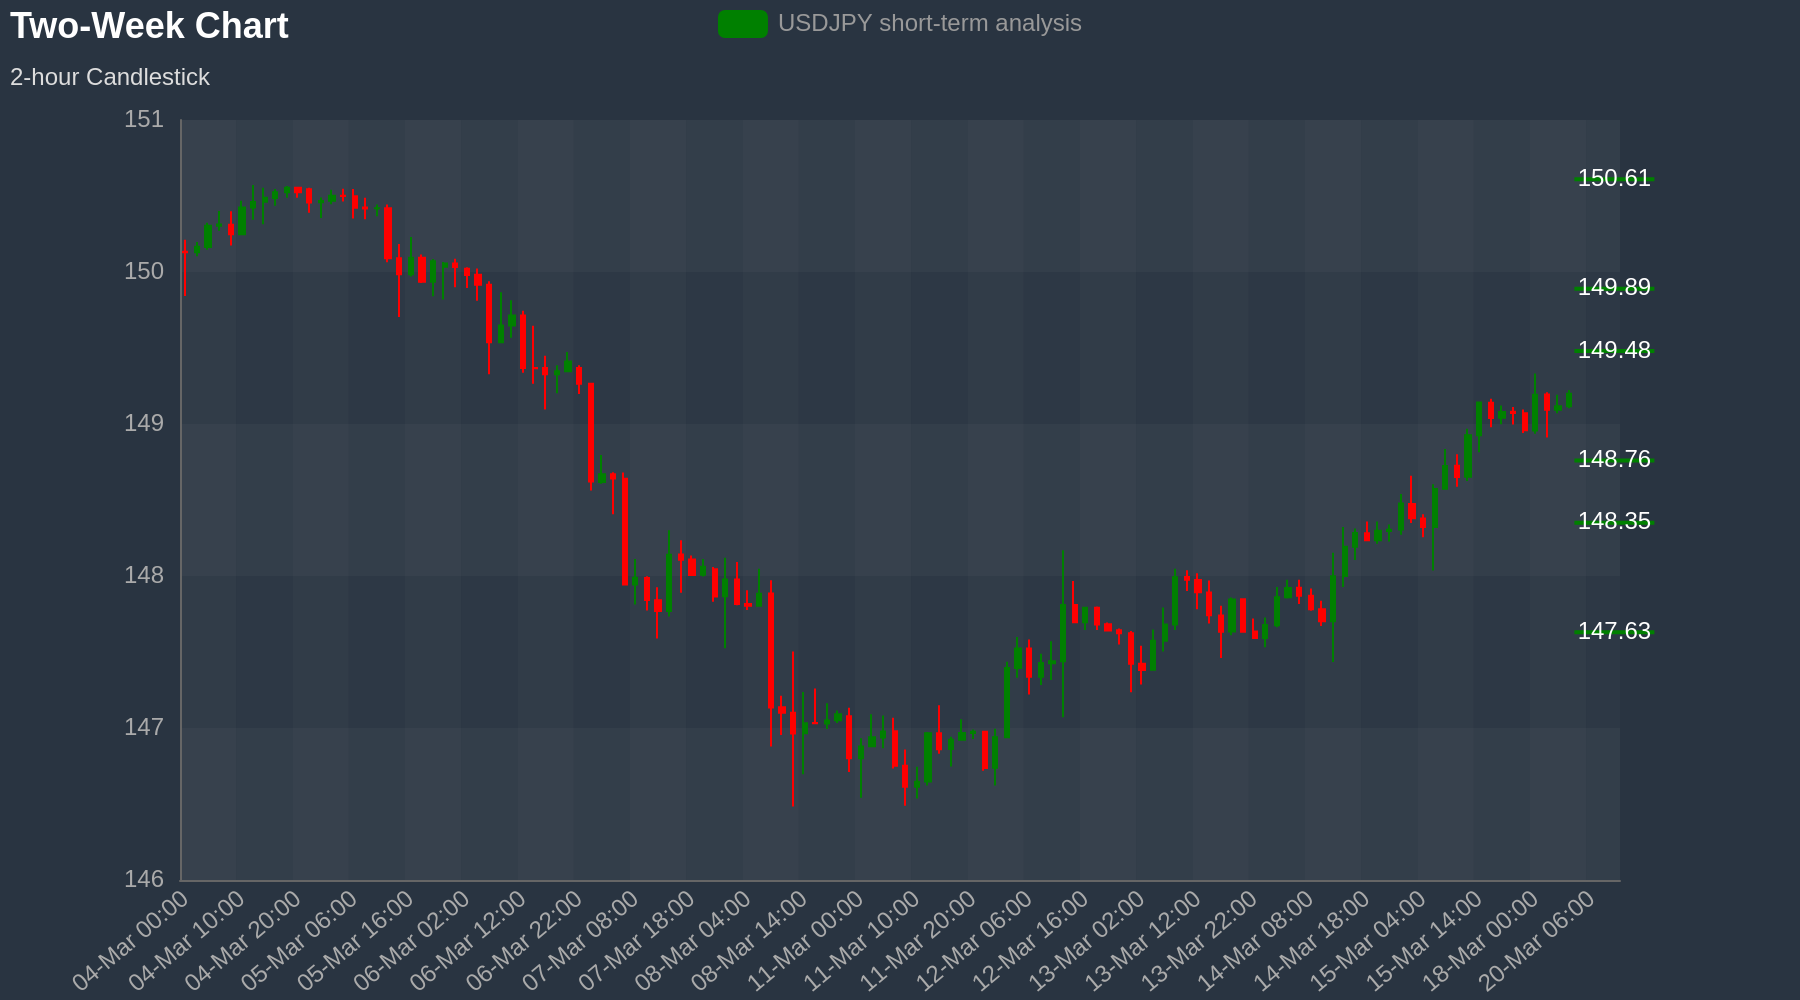
Strategy: Support at 148.76 for 149.48
Short-term view: USDJPY support comes in at 148.76 MACD and RSI have a bullish bias. Hence, we see a bounce to 149.48 enter at 149.0. Below 148.76 to open 148.35
AUDUSD Chart (Two-week)
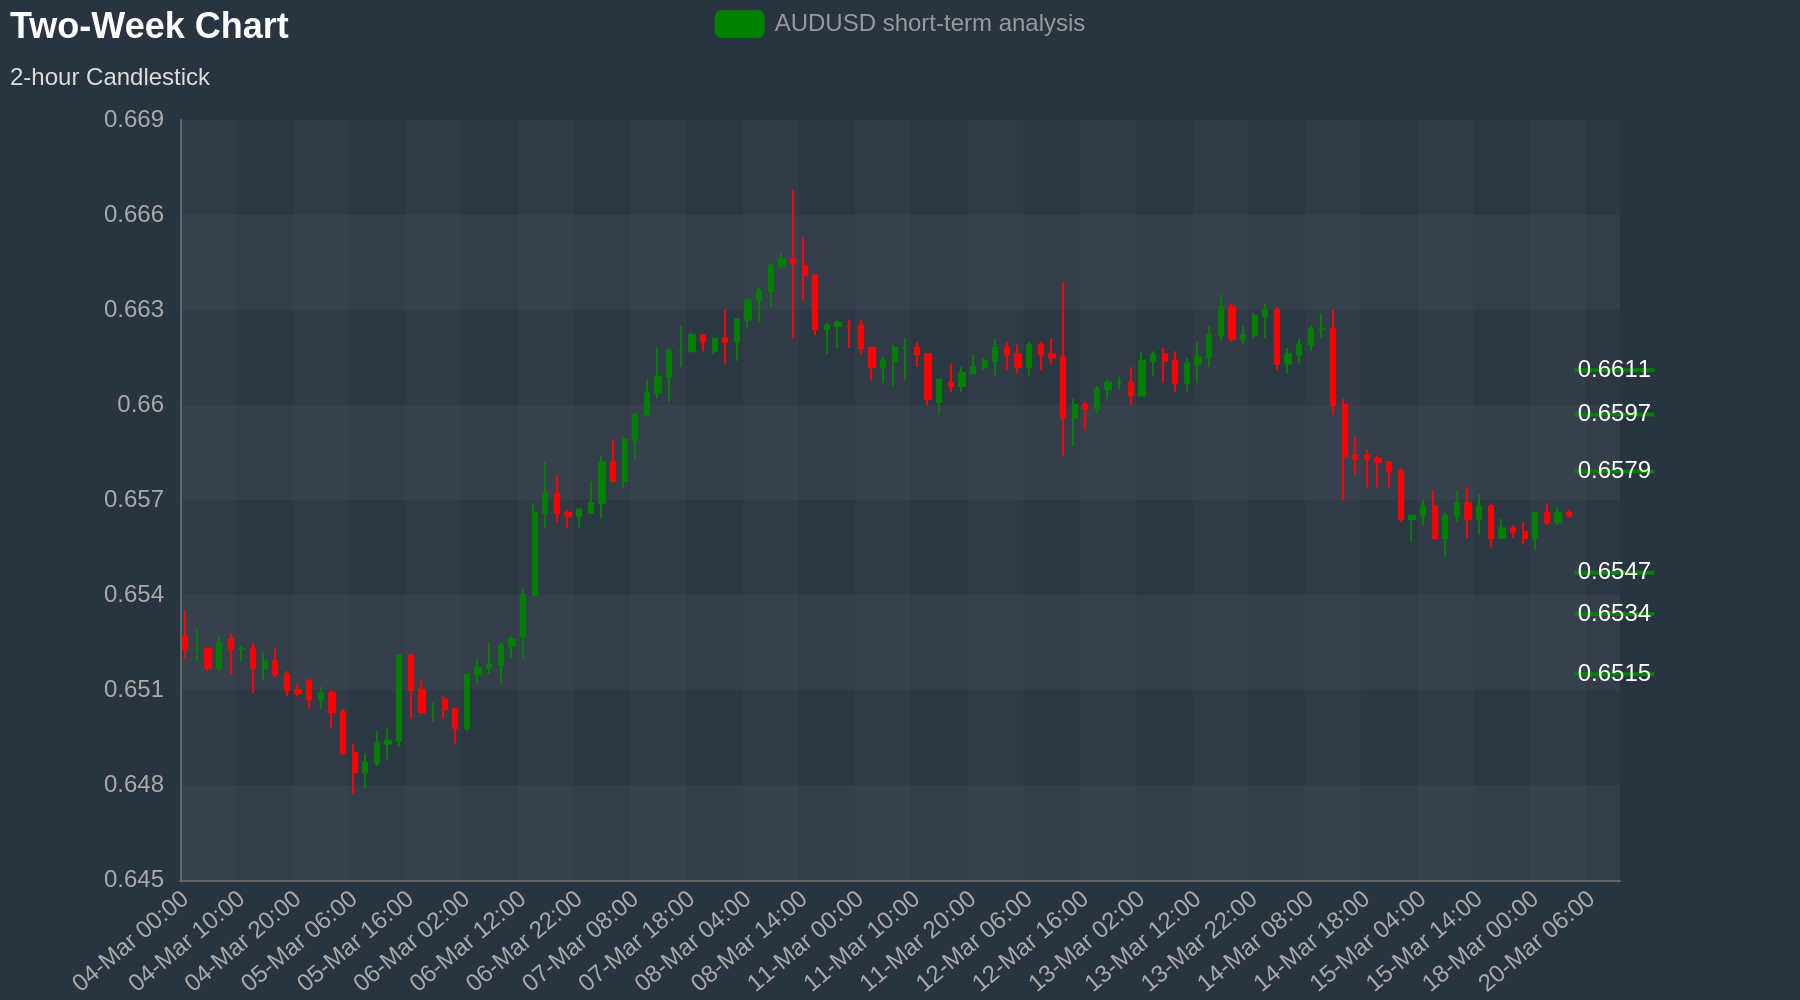
Strategy: Resistance at 0.6579 for 0.6547
Short-term view: AUDUSD MACD and RSI are flat but resistance comes in at 0.6579 and we see a dip to 0.6547 enter at 0.6568. Above 0.6579 to open 0.6597