FX-Strategy 16 Apr 2024
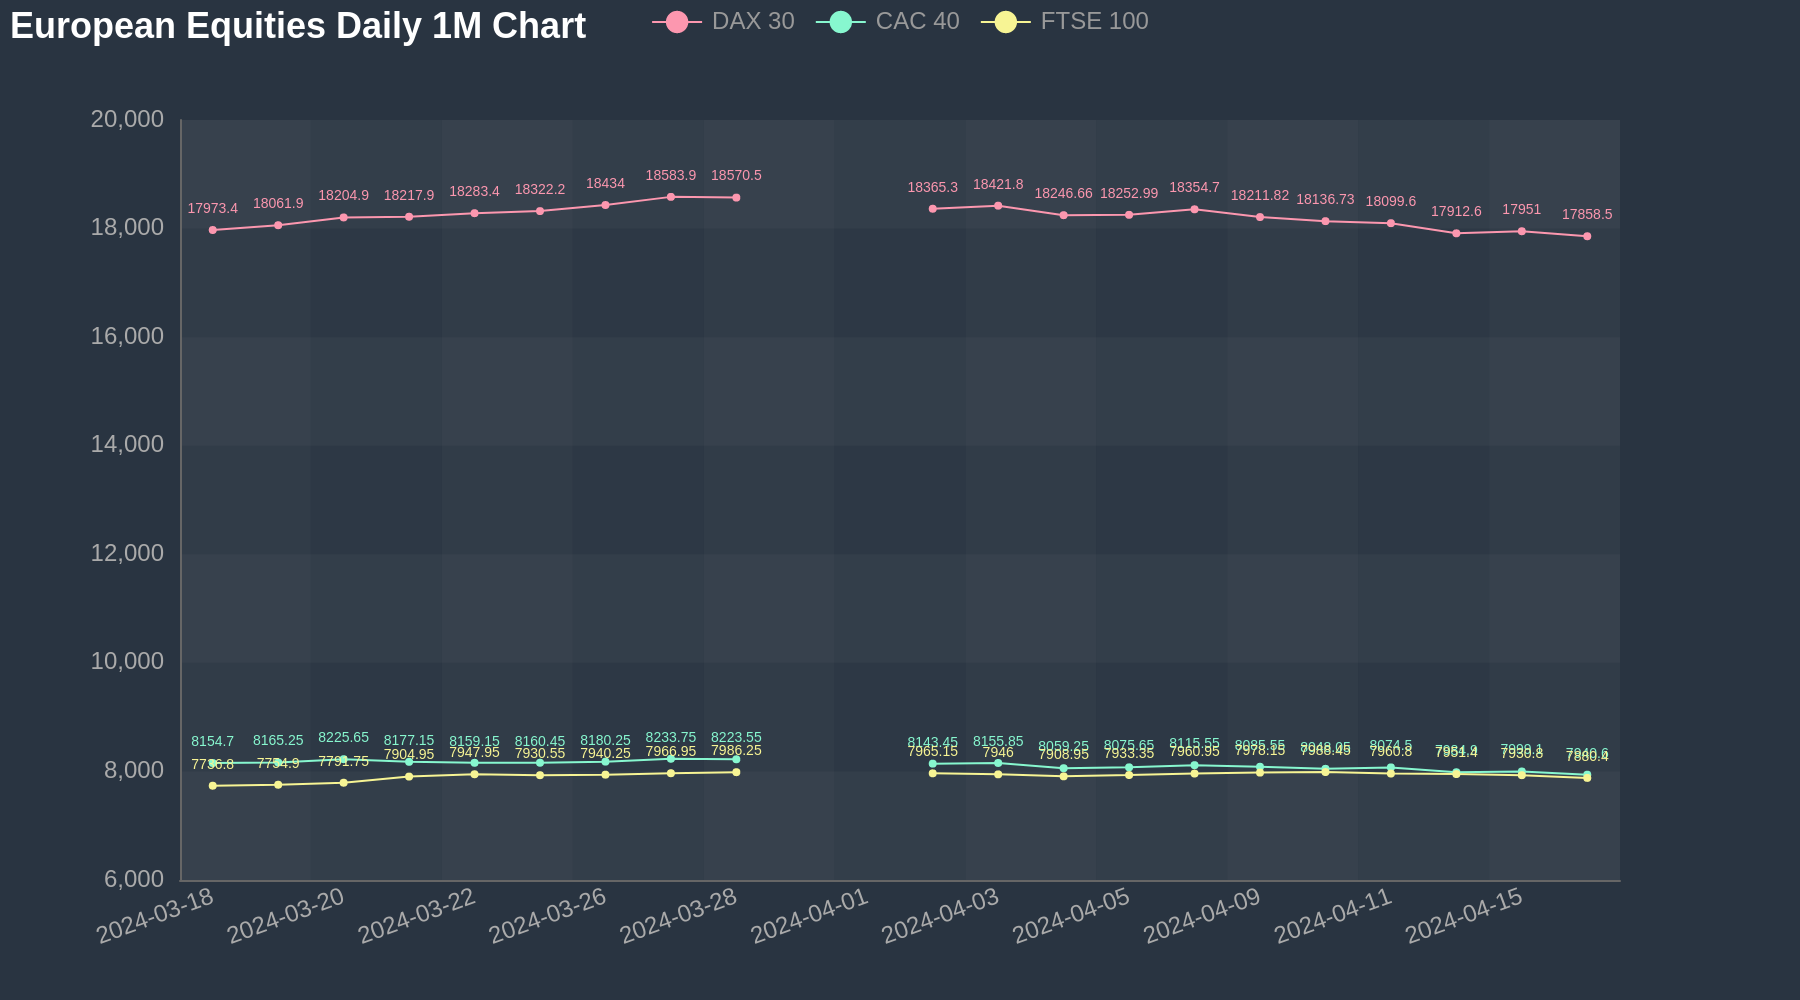
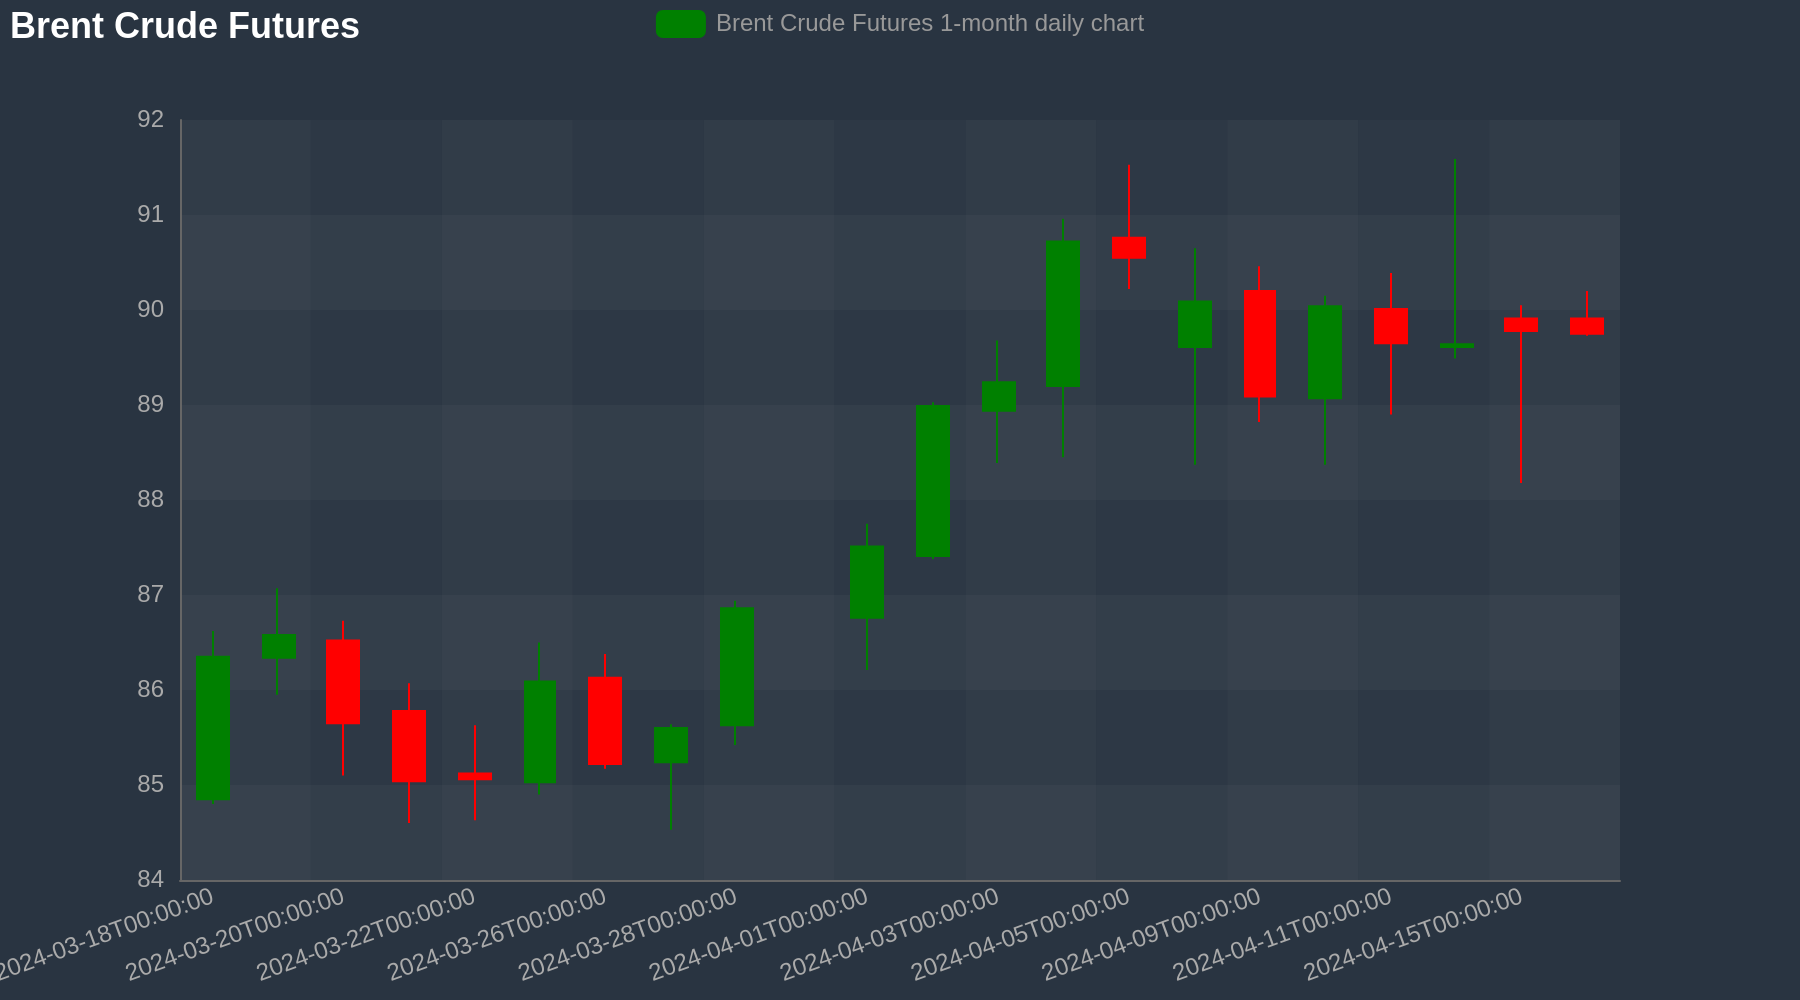
In the G10 FX Market, USD and EUR are the top gainers today while AUD and SEK are the top losers, down -0.46% and -0.37% versus the dollar, respectively. In the Asian equities, markets were trading weaker today. The Hang Seng was trading at 16201.0, down -1.18%. The Nikkei 225 was trading at 38395.0, down -0.76%. In the European equities, indices were trading weaker today. The FTSE 100 was trading at 7880.3999, down -0.64%. The CAC 40 was trading at 7940.6001, down -0.73%. The DAX 30 was trading at 17858.5, down -0.52%. Looking at Equity Futures so far,The SP500 Futures was trading at 5054.9502, down -0.18%. In the Energy space, Oil futures were trading weak today. The Brent Crude Futures was trading at 89.751, down -0.04%. The WTI Crude Futures was trading at 85.111, down -0.13%.
Download intraday historical Forex data in CSV files for free at TraderMade
European Equities Daily Chart (1-month)
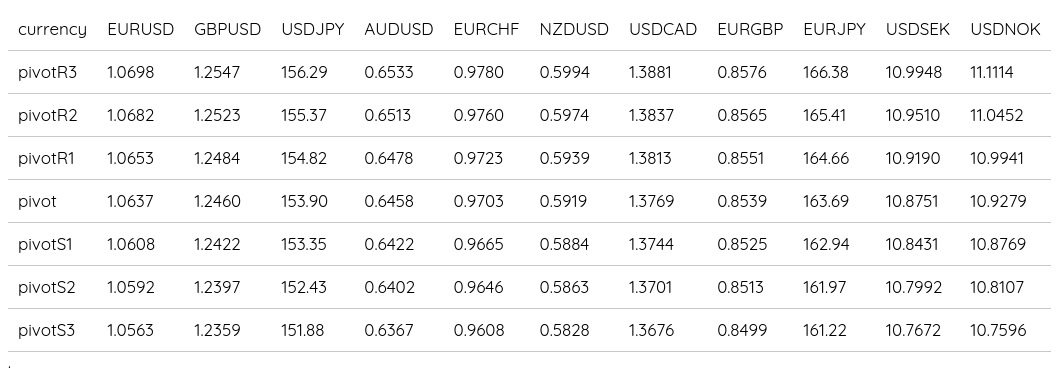
Daily FX Pivots
Brent Crude Daily Chart (1-month)
Forex Chart and Technical Analysis
EURUSD Chart (Two-week)
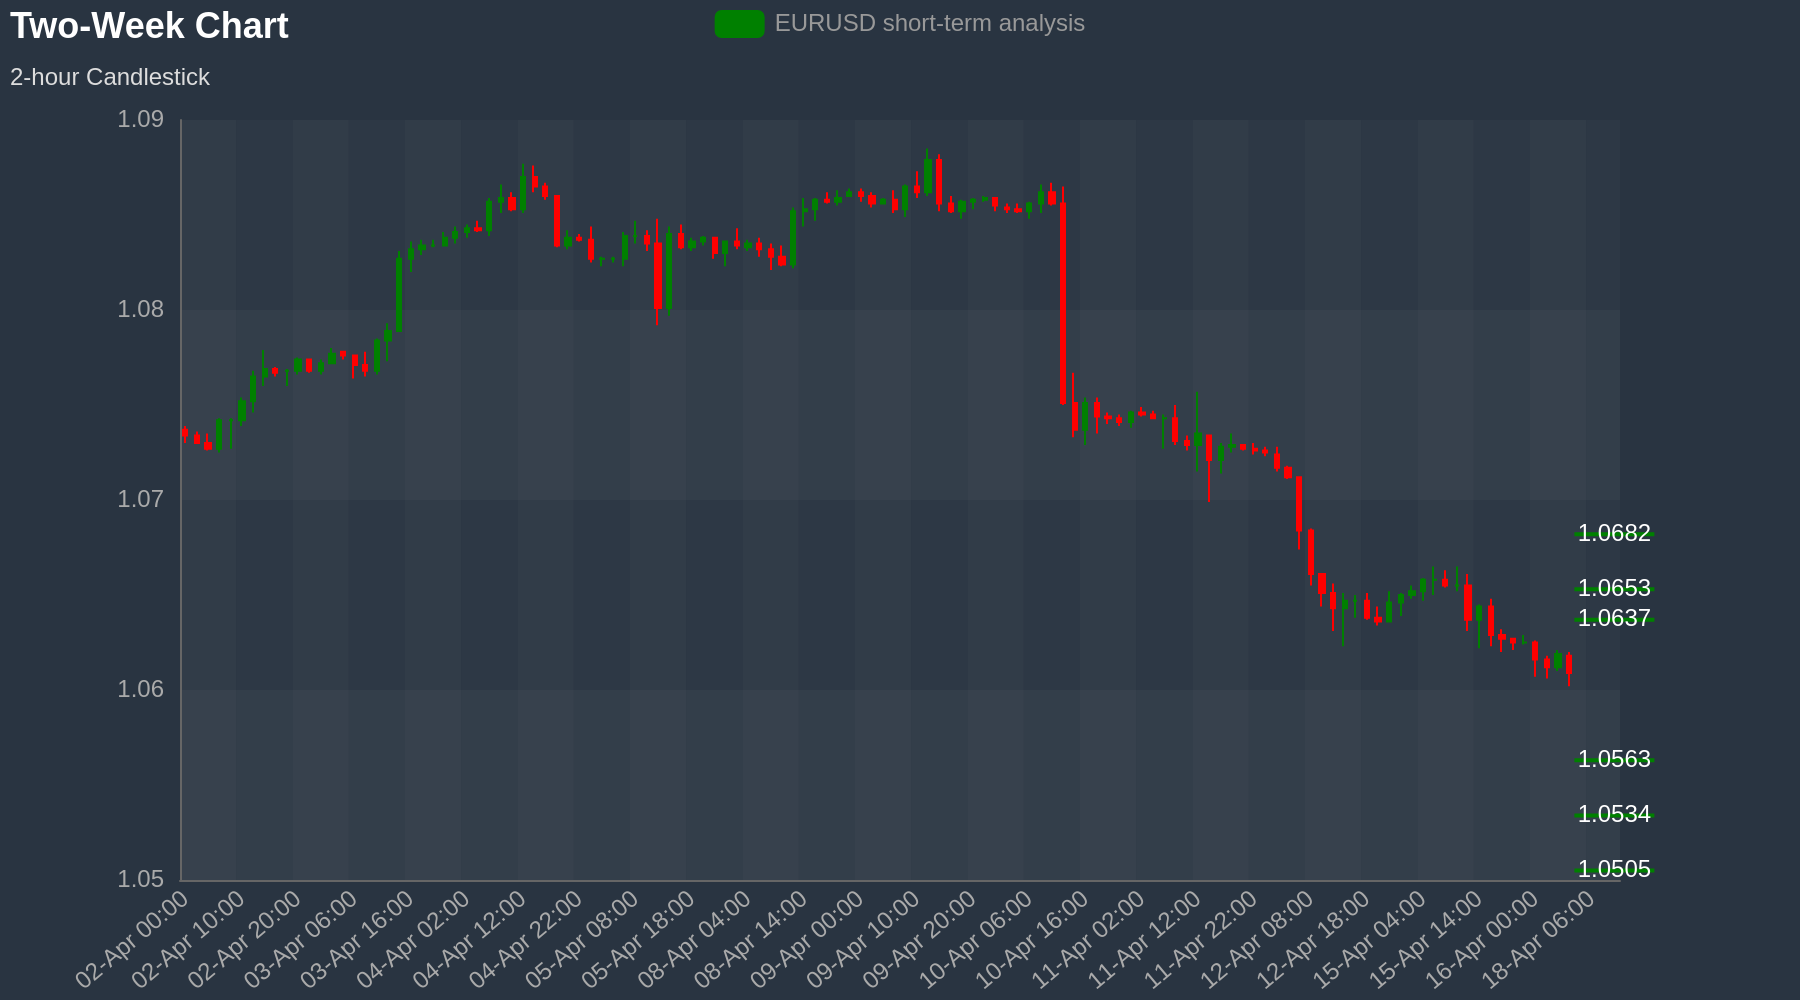
Strategy: Resistance at 1.0637 for 1.0563
Short-term view: EURUSD MACD and RSI are flat but resistance comes in at 1.0637 and we see a dip to 1.0563 enter at 1.0613. Above 1.0637 to open 1.0653
GBPUSD Chart (Two-week)
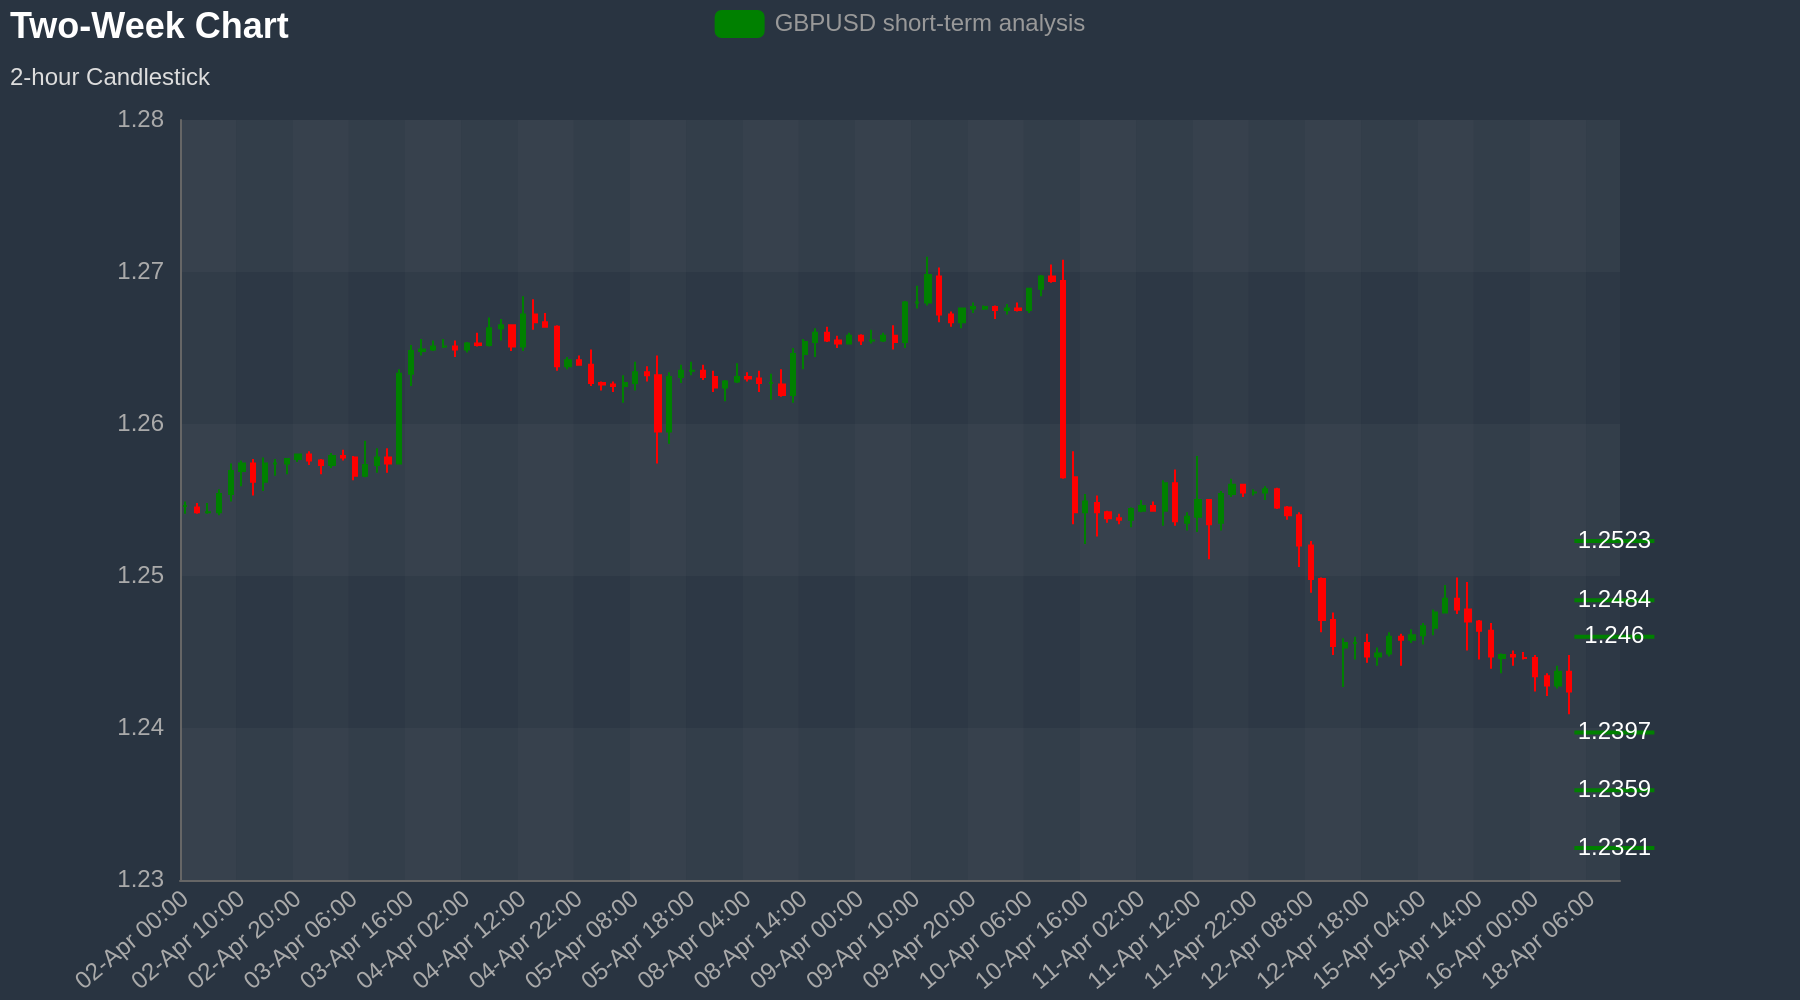
Strategy: Support at 1.2397 for 1.246
Short-term view: GBPUSD MACD and RSI are flat but support comes in at 1.2397 and we see a rise to 1.246 enter at 1.2418. Below 1.2397 to open 1.2359
USDJPY Chart (Two-week)
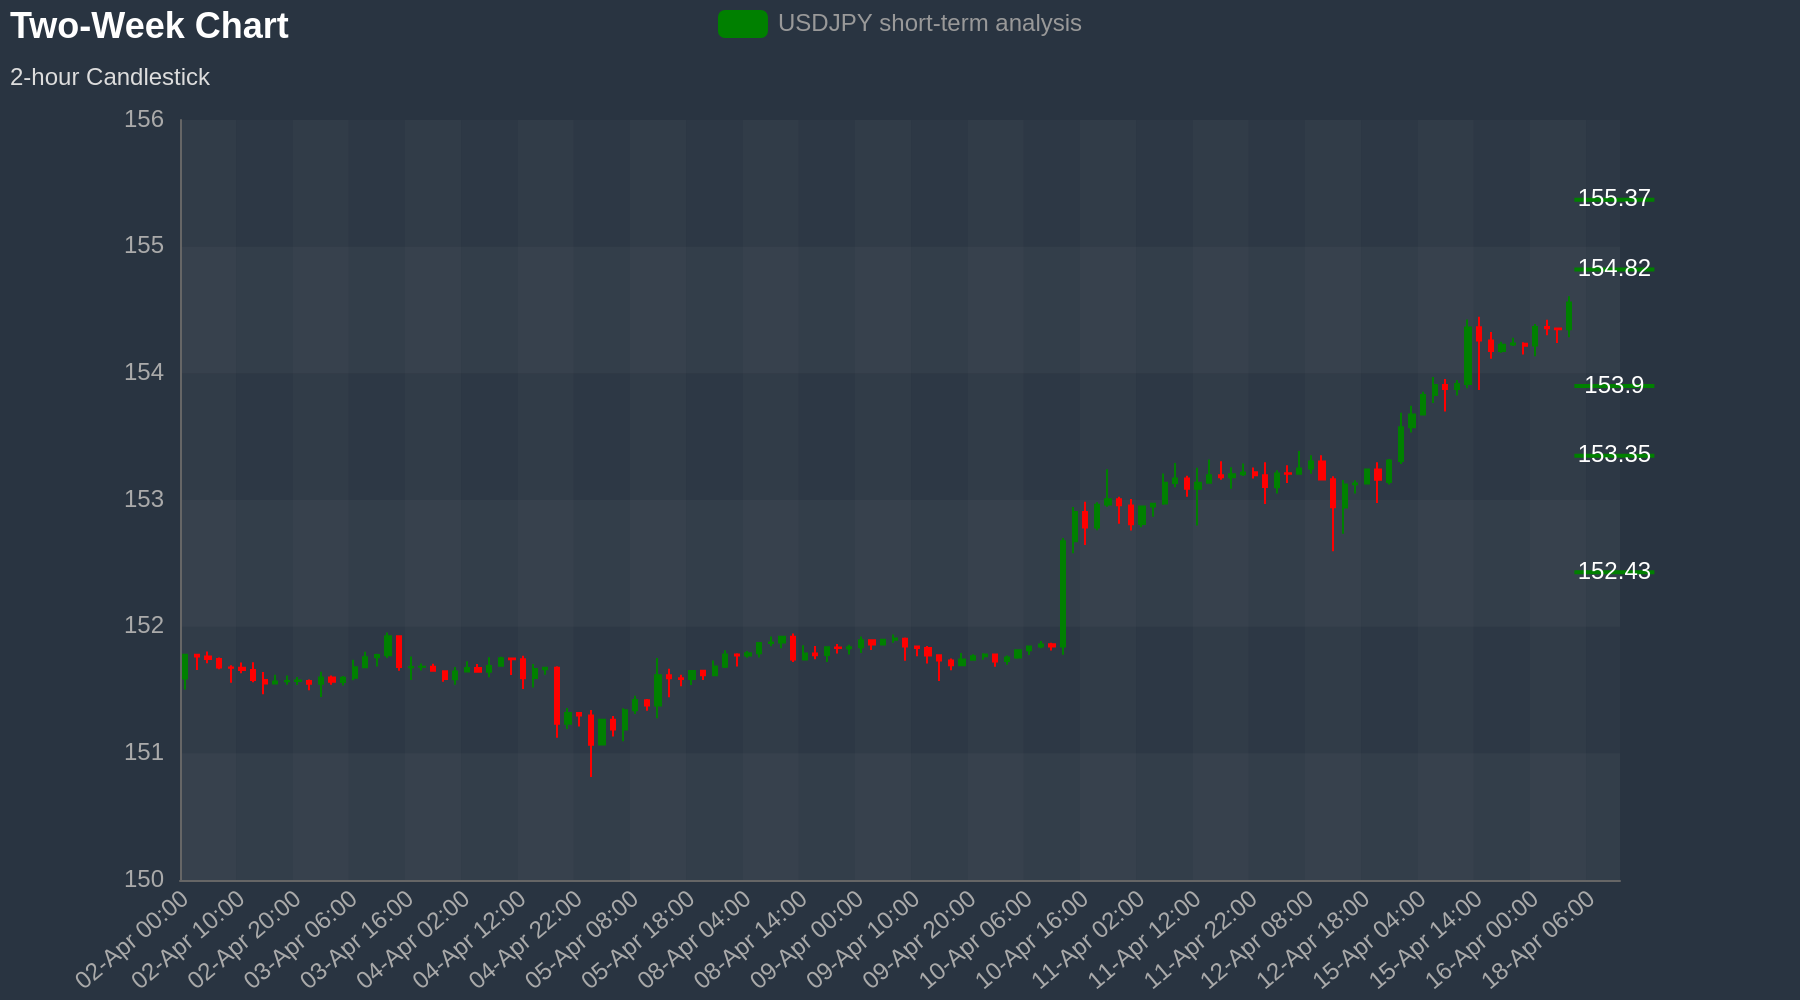
Strategy: Support at 153.9 for 154.82
Short-term view: USDJPY support comes in at 153.9 MACD and RSI have a bullish bias. Hence, we see a bounce to 154.82 enter at 154.2. Below 153.9 to open 153.35
AUDUSD Chart (Two-week)
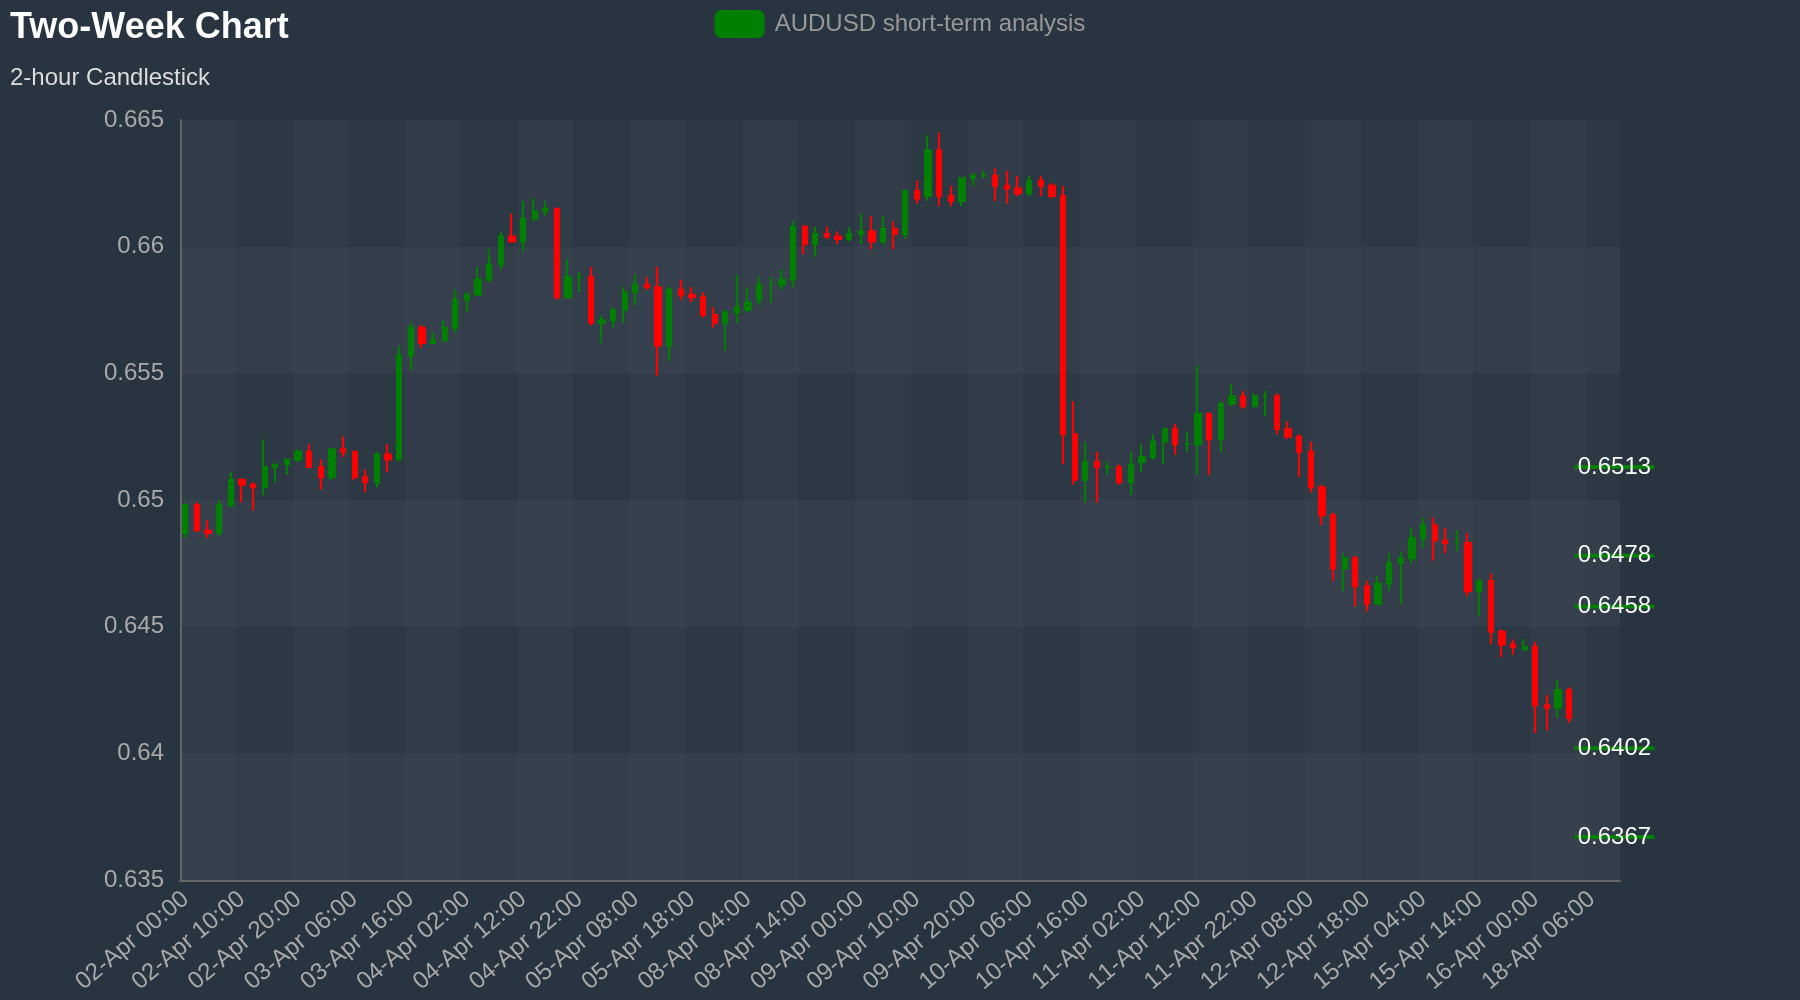
Strategy: Resistance at 0.6458 for 0.6402
Short-term view: AUDUSD resistance comes in at 0.6458 MACD and RSI have a bearish bias. Hence, we see a dip to 0.6402 enter at 0.644. Above 0.6458 to open 0.6478