FX-Strategy 15 Apr 2024
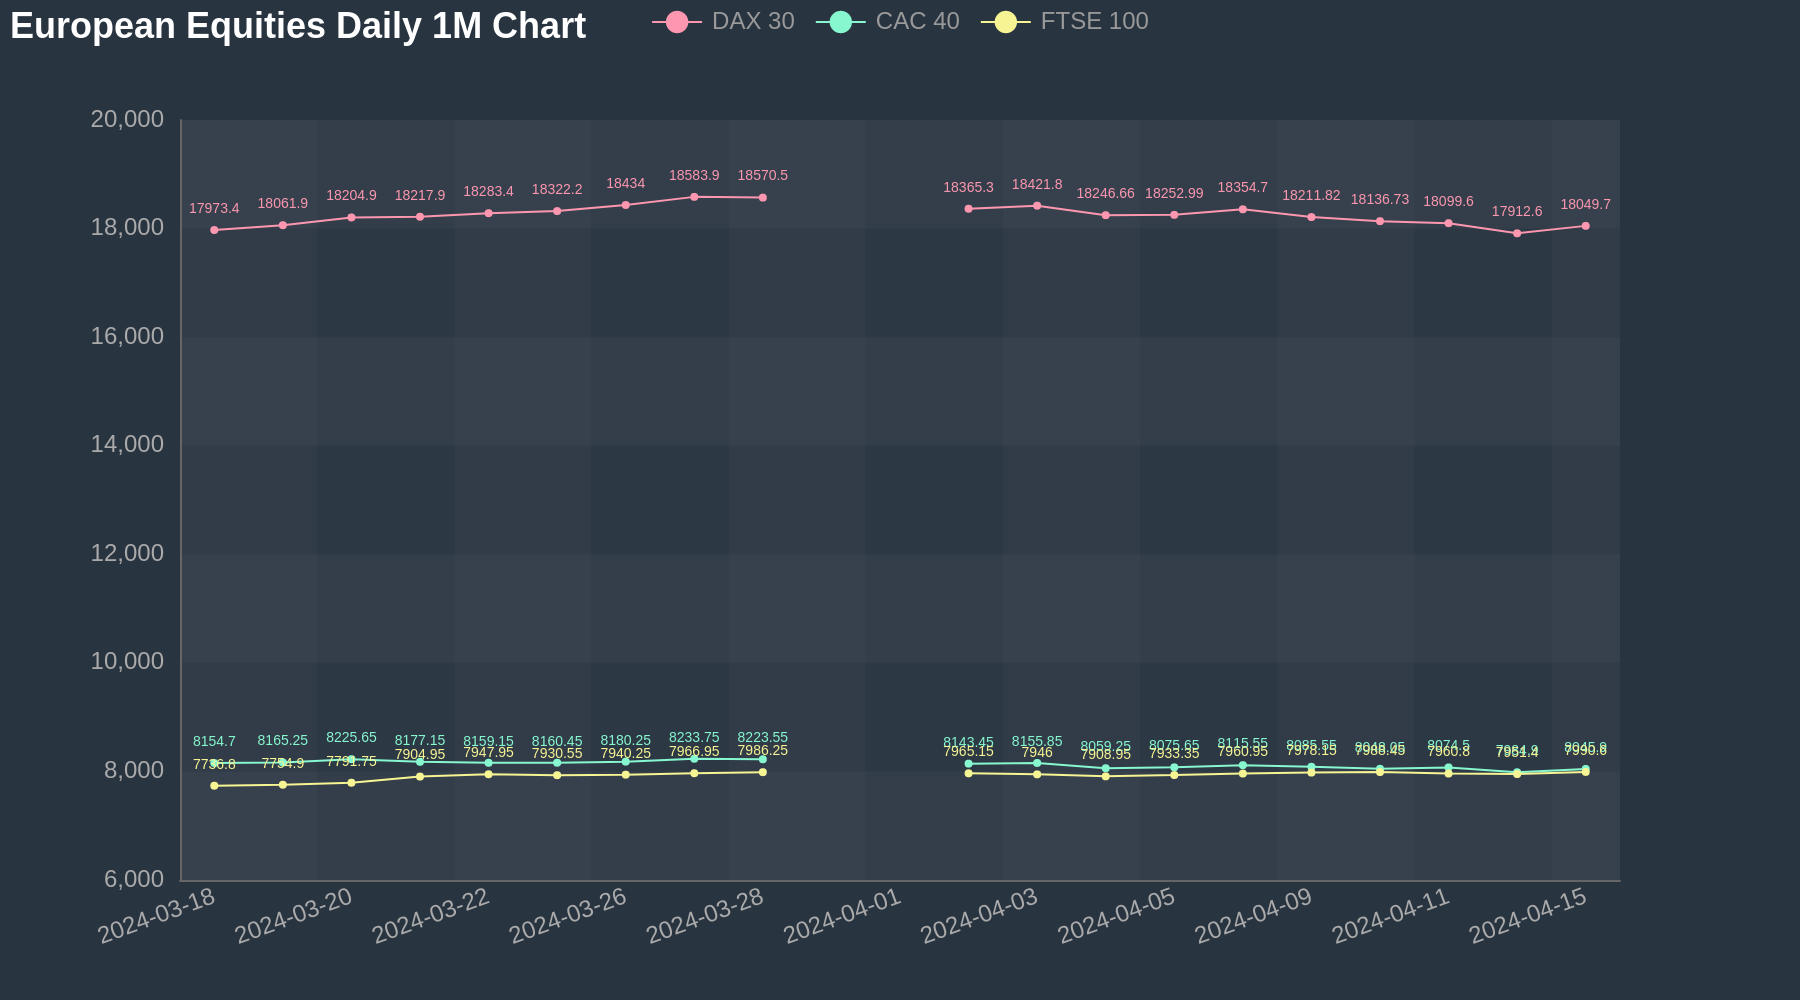
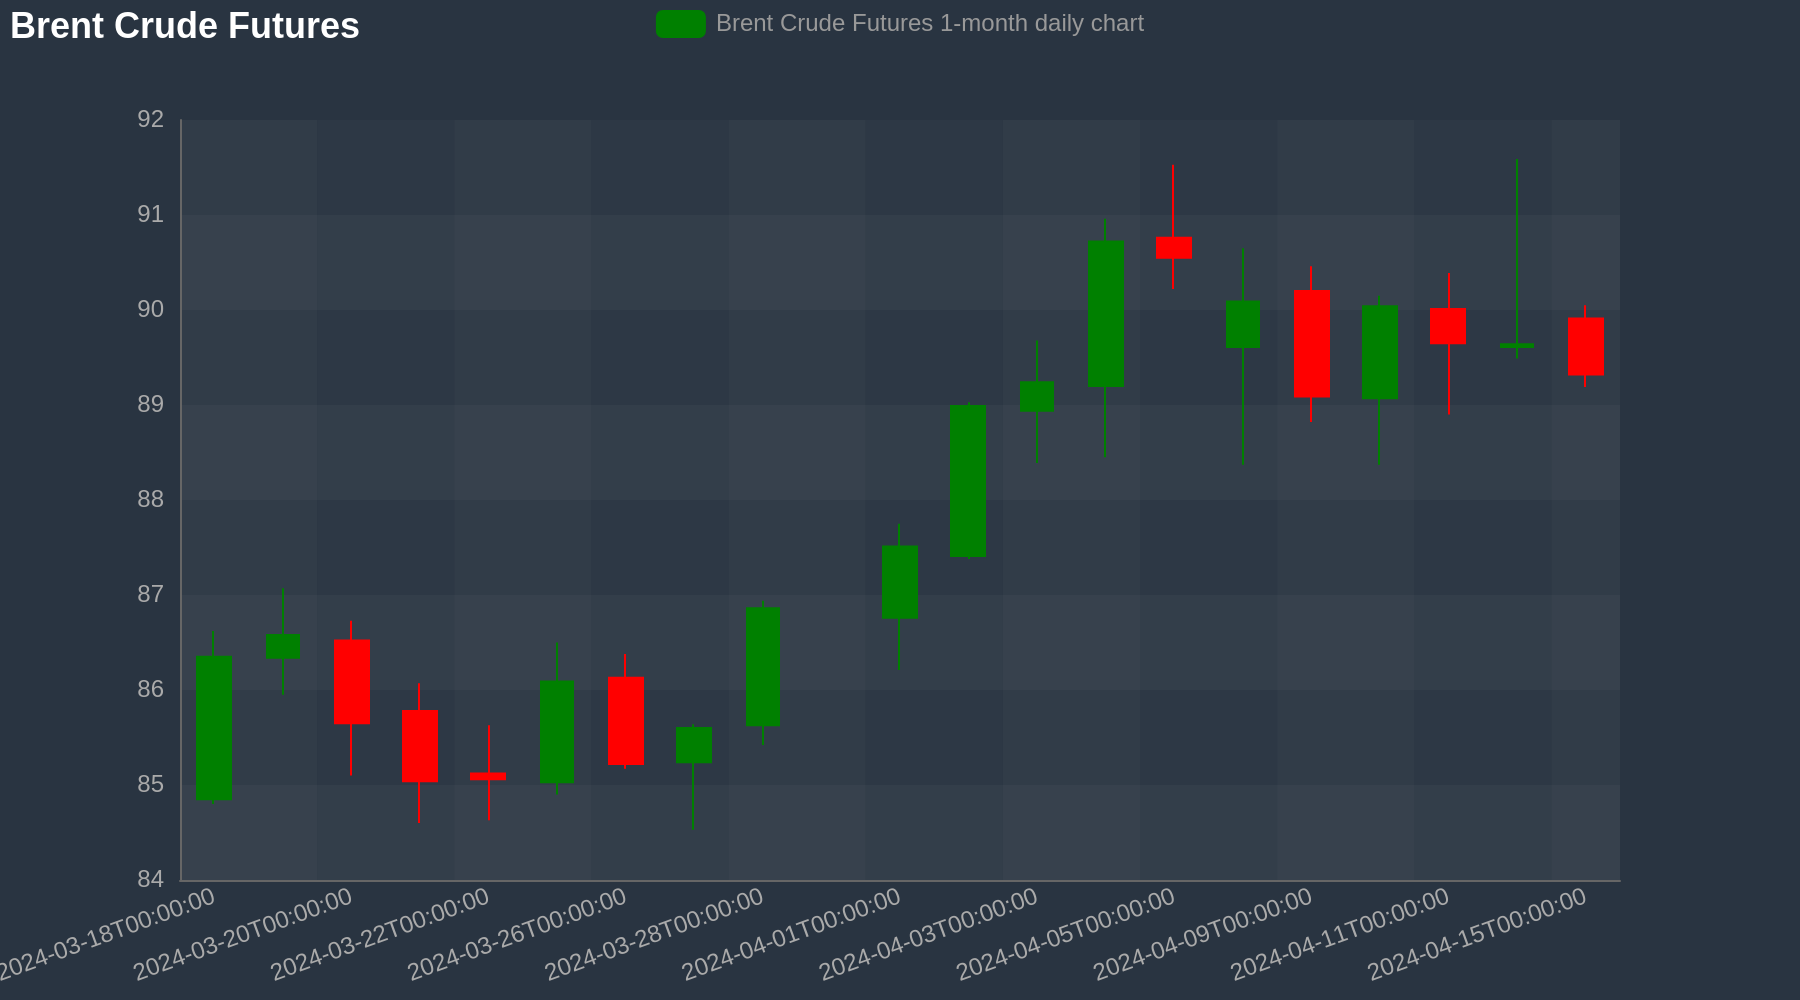
In the G10 FX Market, AUD and SEK are the top gainers today, up 0.42% and 0.24% versus the dollar while USD and JPY are the top losers. In the Asian equities, markets were trading firm today. The Nikkei 225 was trading at 39227.5, up 0.53%. The Hang Seng was trading at 16594.0, up 0.99%. In the European equities, indices were trading firm today. The DAX 30 was trading at 18049.6992, up 0.77%. The CAC 40 was trading at 8045.8999, up 0.76%. The FTSE 100 was trading at 7990.6001, up 0.49%. Looking at Equity Futures so far,The SP500 Futures was trading at 5152.7002, up 0.18%. In the Energy space, Oil futures were trading weaker today. The Brent Crude Futures was trading at 89.323, down -0.36%. The WTI Crude Futures was trading at 84.569, down -0.57%.
Download intraday historical Forex data in CSV files for free at TraderMade
European Equities Daily Chart (1-month)
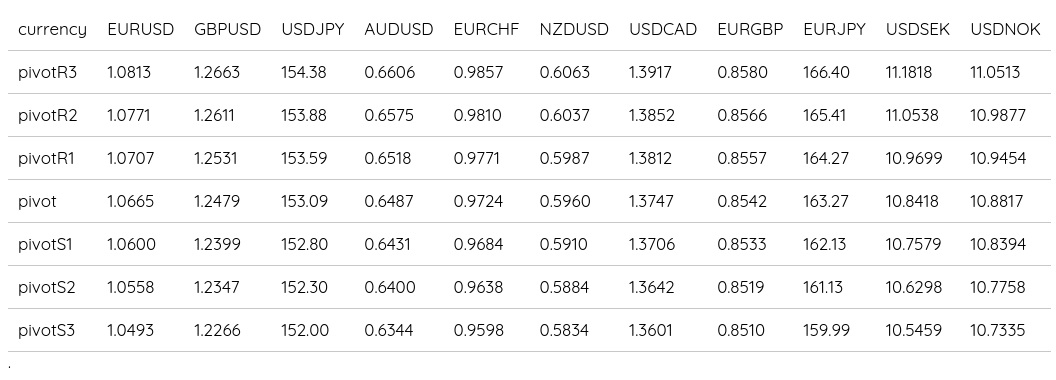
Daily FX Pivots
Brent Crude Daily Chart (1-month)
Forex Chart and Technical Analysis
EURUSD Chart (Two-week)
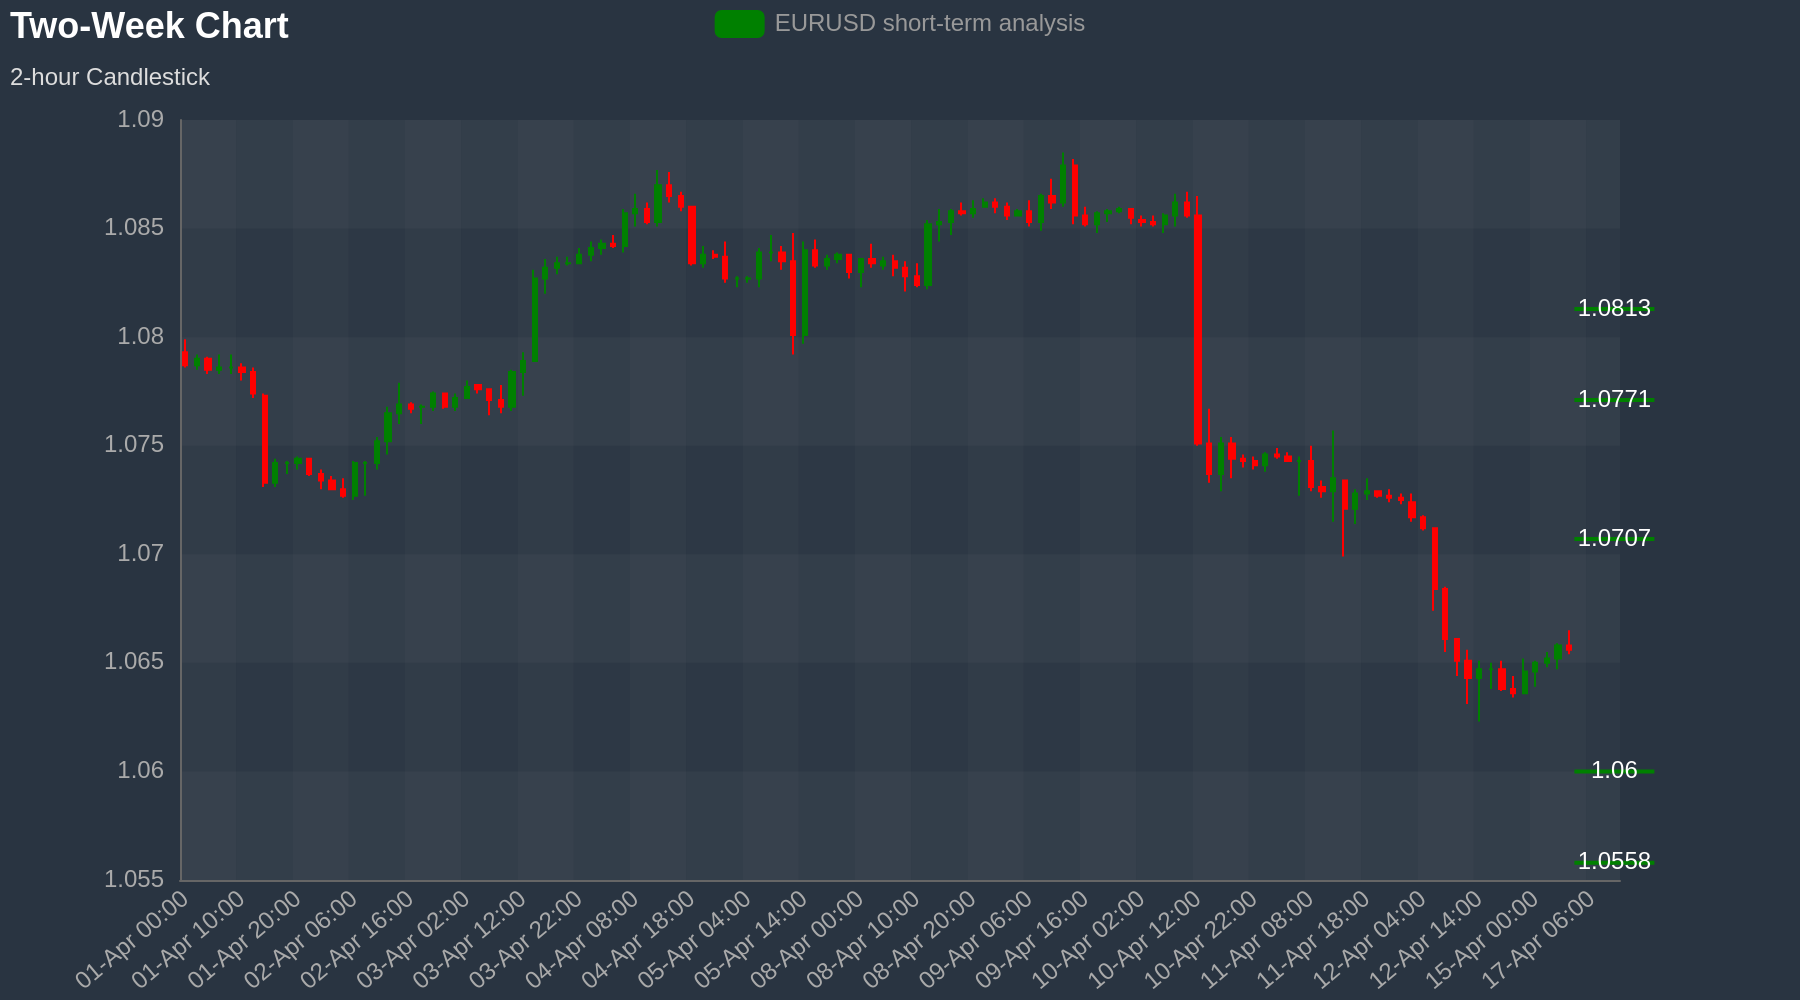
Strategy: Resistance at 1.0707 for 1.06
Short-term view: EURUSD MACD and RSI are flat but resistance comes in at 1.0707 and we see a dip to 1.06 enter at 1.0672. Above 1.0707 to open 1.0771
GBPUSD Chart (Two-week)
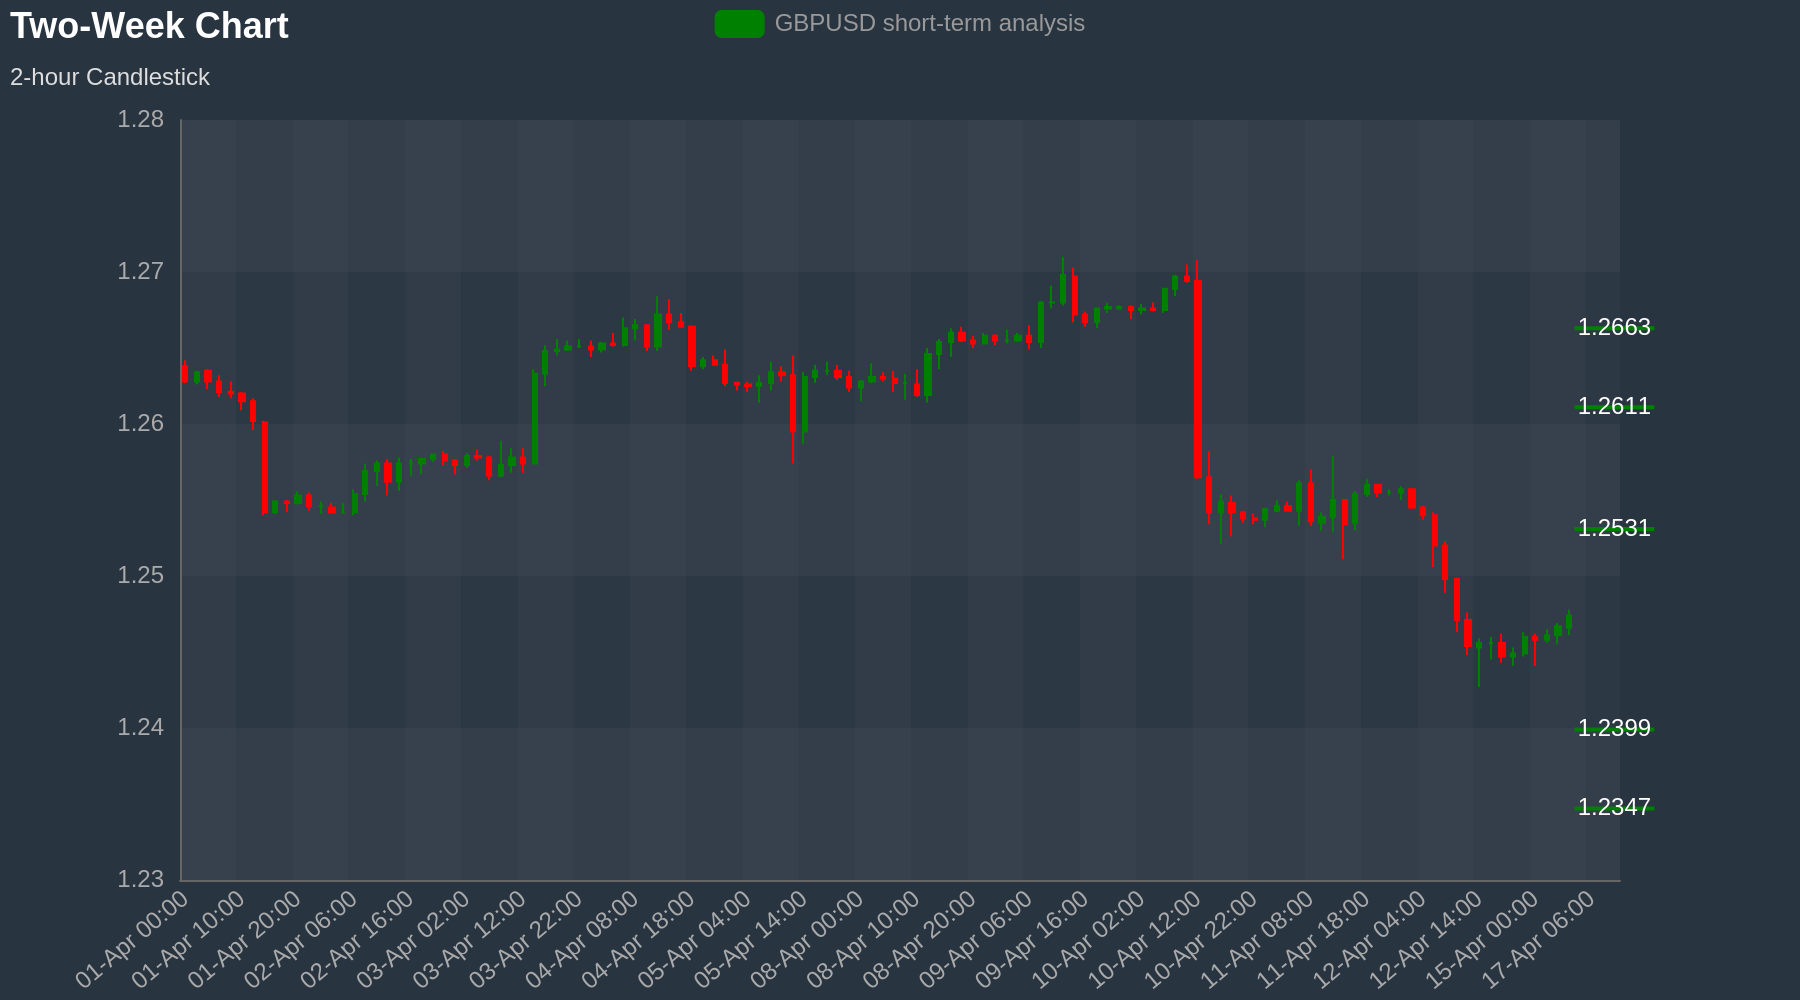
Strategy: Resistance at 1.2531 for 1.2399
Short-term view: GBPUSD resistance comes in at 1.2531 MACD and RSI have a bearish bias. Hence, we see a dip to 1.2399 enter at 1.2487. Above 1.2531 to open 1.2611
USDJPY Chart (Two-week)
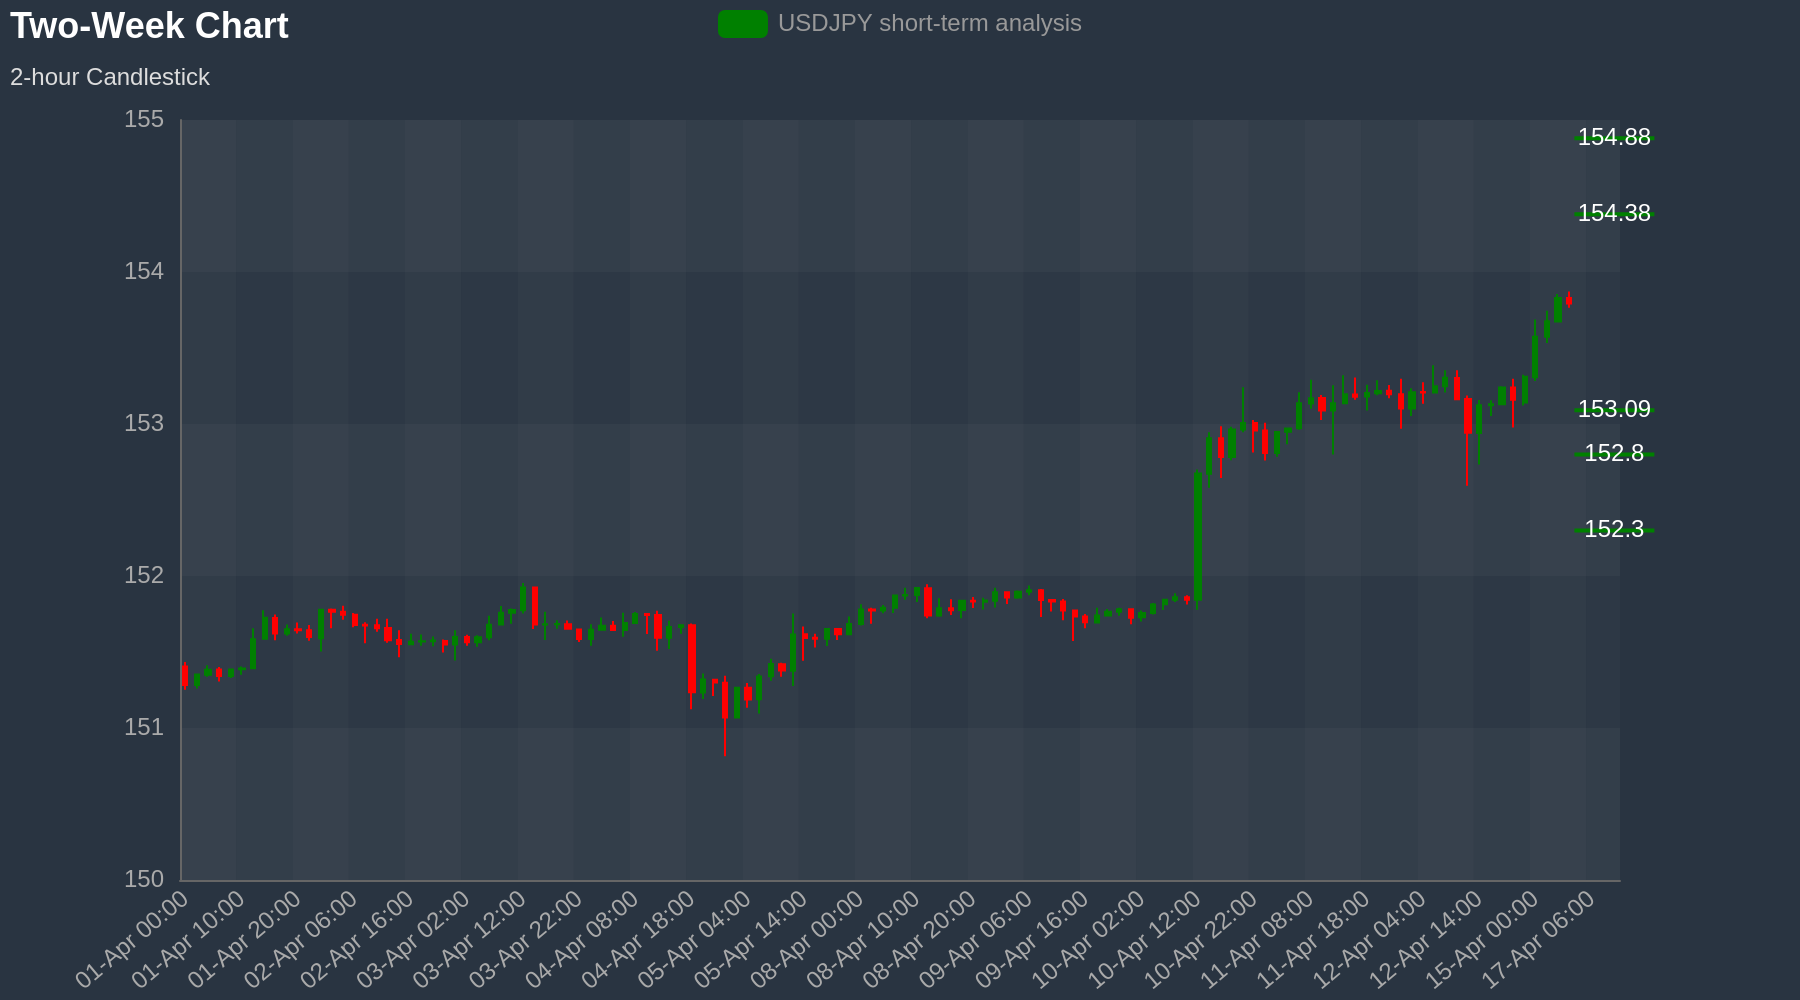
Strategy: Resistance at 154.38 for 153.09
Short-term view: USDJPY MACD and RSI are flat but resistance comes in at 154.38 and we see a dip to 153.09 enter at 153.95. Above 154.38 to open 154.88
AUDUSD Chart (Two-week)
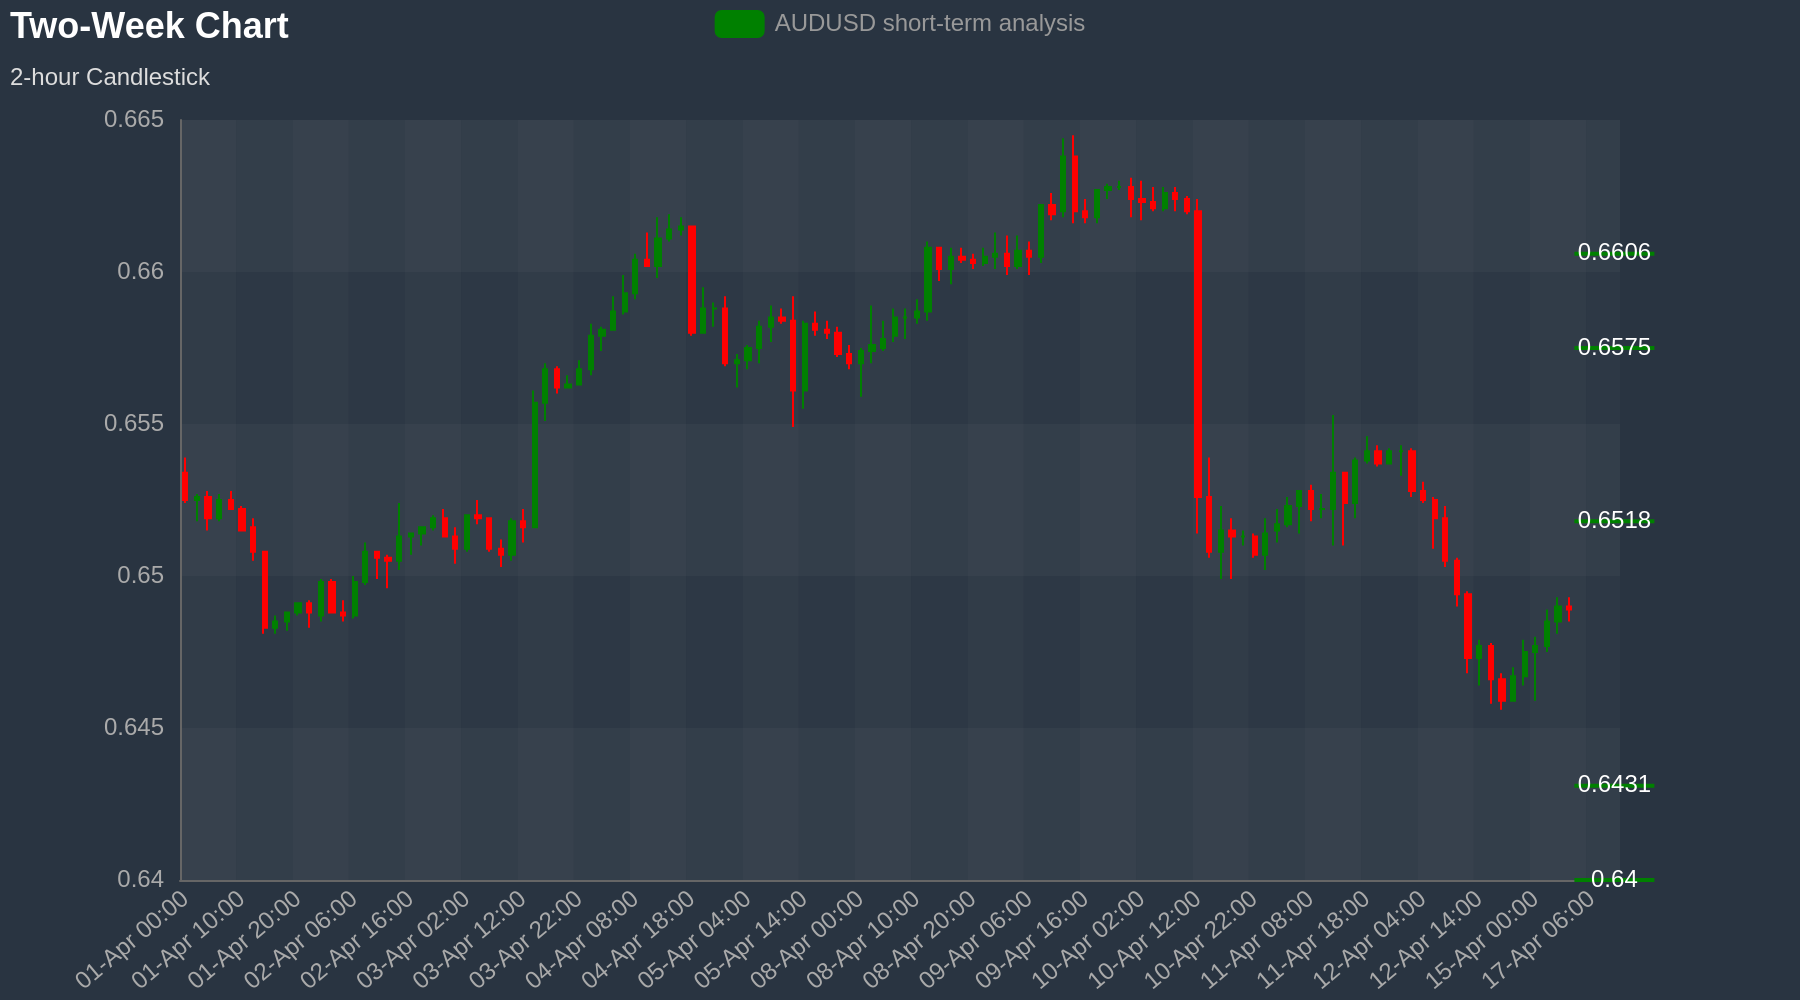
Strategy: Resistance at 0.6518 for 0.6431
Short-term view: AUDUSD MACD and RSI are flat but resistance comes in at 0.6518 and we see a dip to 0.6431 enter at 0.6489. Above 0.6518 to open 0.6575